
UAE Signs Historic LNG Deal With China, Reshaping Global Energy Trade Patterns
The China-UAE Energy Pivot: Landmark LNG Deal Reshapes Global Energy Trade
UAE Inks Historic LNG Supply Agreements With China, Signaling Strategic Shift in Global Energy Alliances
BEIJING — Standing in the gleaming new Abu Dhabi National Oil Company (ADNOC) office in Beijing's central business district, Sultan Ahmed Al Jaber proudly declared a "new chapter" in UAE-China energy cooperation. The UAE's Minister of Industry and Advanced Technology and ADNOC's Managing Director wasn't exaggerating — the three liquefied natural gas (LNG) agreements signed on April 18 represent the largest-ever LNG deal between the UAE and China, strategically repositioning both nations in the global energy landscape.
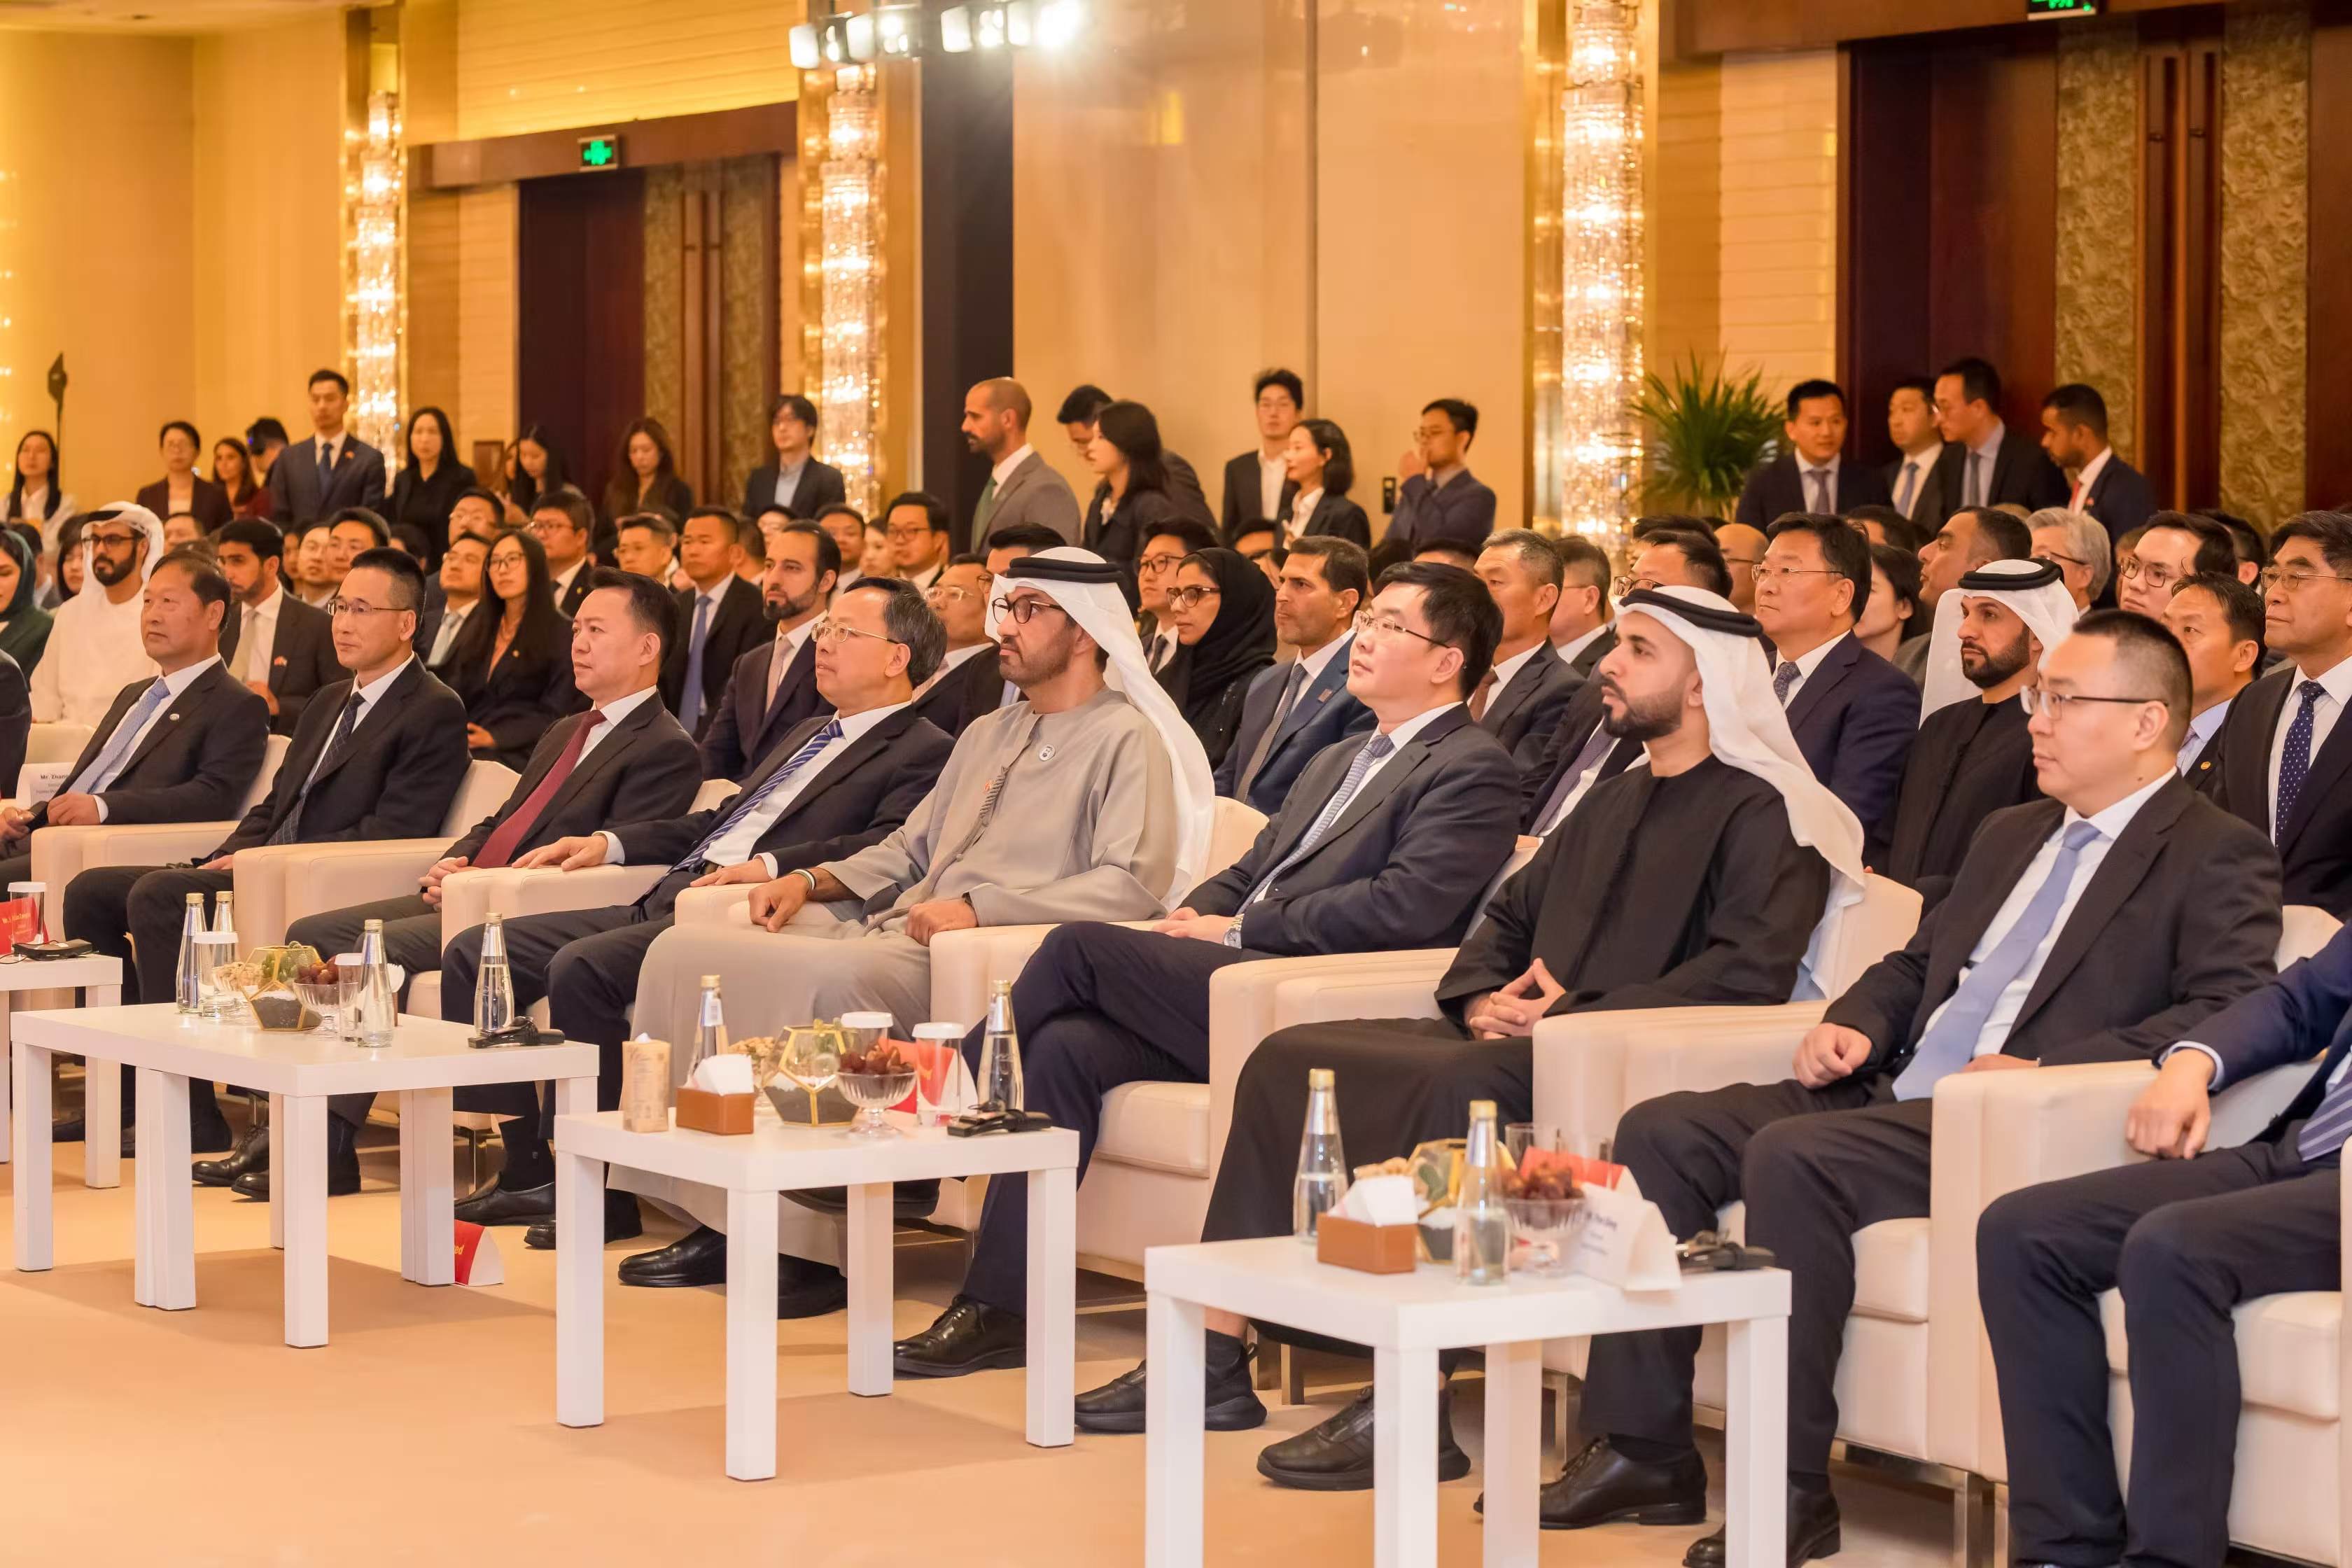
"These agreements aren't merely about trading commodities," An insider who attended the signing ceremony today said to us. "They represent a cornerstone in ensuring China's energy security while affirming the UAE's position as a reliable global energy supplier."
The landmark deal encompasses three separate agreements: a 15-year contract for ADNOC to supply up to 1 million metric tons of LNG annually to ENN Natural Gas, a 5-year agreement with Zhenhua Oil for up to 12 LNG cargoes per year starting in 2026, and a third agreement with CNOOC Gas & Power Group, with specific details not publicly disclosed.

Liquefied Natural Gas (LNG) is natural gas that has been cooled to approximately -162°C (-260°F), turning it into a liquid. This liquefaction process dramatically reduces its volume, making it significantly easier and more economical to transport over long distances via specialized ships where pipelines are not feasible.
But beyond the impressive figures lies a complex web of geopolitical calculations, strategic hedging, and economic diversification that reveals much about the shifting dynamics of global energy trade.
A Strategic Pivot Away From Traditional Suppliers
The timing of these agreements comes amid heightened trade tensions between China and traditional energy suppliers like the United States and Australia. Energy analysts suggest this represents a deliberate pivot by Chinese buyers.
"China is methodically diversifying its energy portfolio away from suppliers where geopolitical friction exists," explains an energy security analyst. "What we're witnessing is the energy dimension of a broader strategic realignment."
China's LNG Import Sources by Country (Past 5-10 Years)
| Country | Share of Imports (2023) | Value of Imports (2023, USD) | Share of Imports (2022) | Value of Imports (2022, USD) | Key Trends & Notes |
|---|---|---|---|---|---|
| Australia | ~33.3% | $14.8 Billion | ~30.6% | $16.0 Billion | Remains China's top LNG supplier consistently over recent years, though import value decreased slightly in 2023 compared to 2022. |
| Qatar | ~23.2% | $10.3 Billion | ~22.1% | $11.5 Billion | Consistently the second-largest supplier. China has signed long-term contracts with Qatar, suggesting its importance will continue. |
| Russia | ~11.7% (LNG only) | $5.18 Billion | ~12.9% (LNG only) | $6.75 Billion | A significant supplier of both LNG and pipeline gas. Total natural gas imports (pipeline + LNG) from Russia are substantial and growing. |
| Malaysia | ~8.8% | $3.92 Billion | ~13.1% | $6.82 Billion | A major supplier, though its share and value saw a notable decrease in 2023 compared to 2022. |
| Indonesia | ~6.0% | $2.68 Billion | ~5.9% | $3.09 Billion | A consistent supplier within the top sources. |
| USA | ~4% (Approx. for 2023) | Not specified in sources | ~4.2% | $2.19 Billion | US LNG imports fluctuated significantly, decreasing sharply in 2022 but rebounding in 2023 and early 2024. Trade tensions impact volumes. |
This deal is part of a pattern. Chinese energy companies have recently secured similar large-scale agreements with Turkmenistan, Russia, Qatar, Iran, and Algeria — creating a diverse portfolio of suppliers largely outside Western influence spheres.
For China, the calculations extend beyond immediate energy needs. While the UAE agreement represents just a fraction of China's overall natural gas demand — approximately 1.3 billion cubic meters annually in a market that consumes around 400 billion cubic meters — its strategic value transcends volume.
"China's domestic production covers about 230 billion cubic meters, leaving an import deficit of roughly 170 billion cubic meters," notes a Beijing-based commodities analyst. "The value of these agreements isn't just in the molecules delivered, but in creating multiple, redundant supply channels that protect against disruption."
China's Natural Gas Supply and Demand Breakdown (Domestic Production vs. Imports)
| Year | Domestic Production (bcm) | Imports (bcm) | Total Consumption (bcm) | Import Dependency (%) |
|---|---|---|---|---|
| 2022 | 220.1 | 150.1 | 364.6 | 41.2% |
| 2023 | 232.4 - 235.3 | 165.5 - 165.6 | 394.5 | 41% - 42.3% |
| 2024 (est/actual) | 245.8 - 246.4 | 174 - 182 | 415.7 - 428 | 40.9% - 42.3% |
| 2025 (proj) | 261.9 | ~184.9+ | 456 | ~40.5% |
UAE's Calculated Economic Diversification
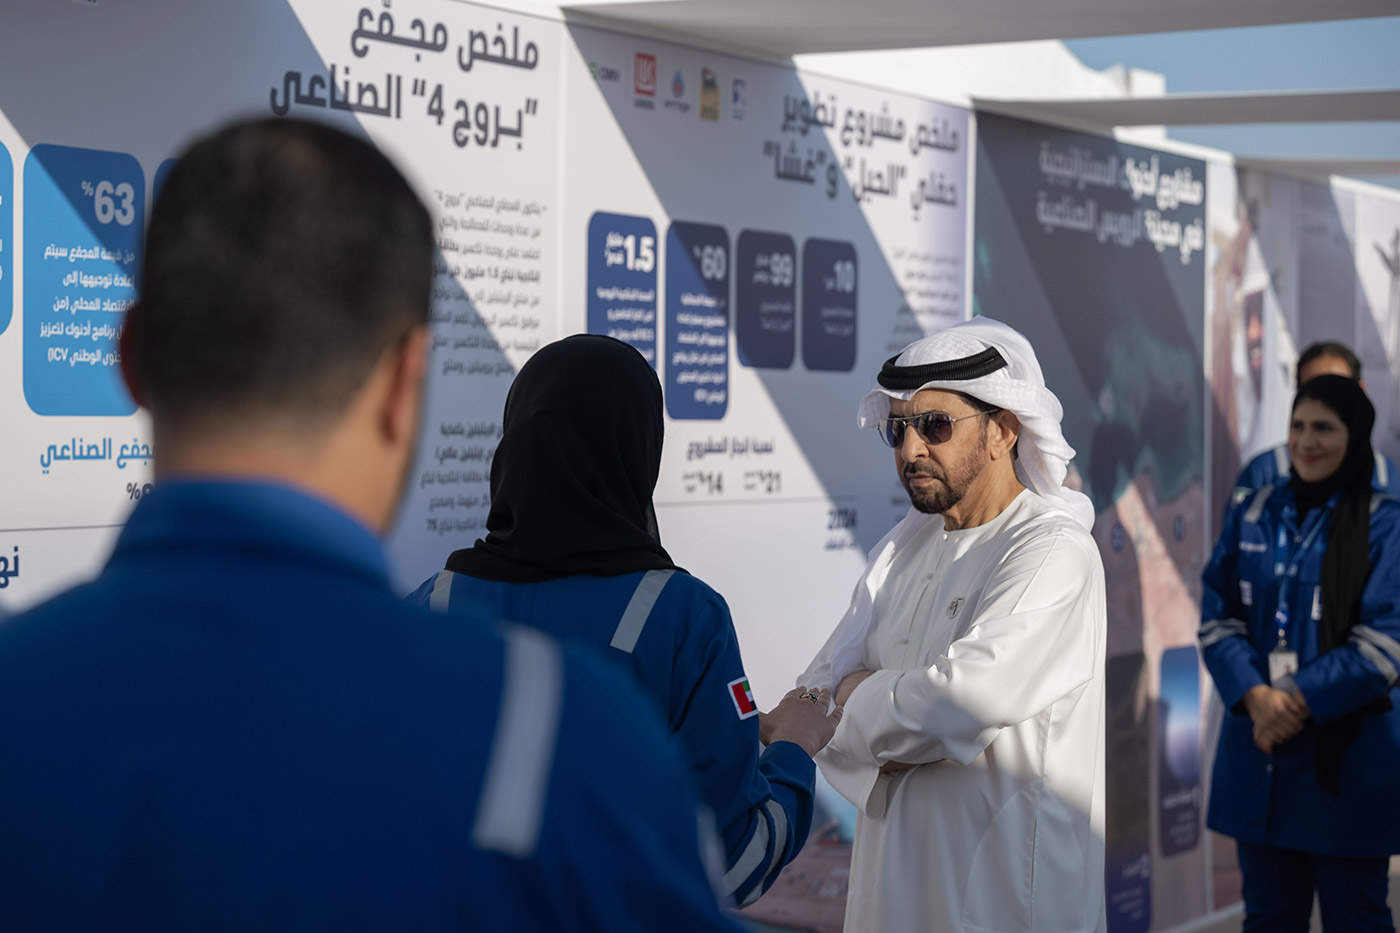
For the UAE, the agreements support its ambitious economic diversification agenda while securing a foothold in the world's largest energy growth market. The opening of ADNOC's Beijing office underscores this long-term commitment.
The LNG shipments will originate from ADNOC's low-carbon Ruwais project — part of the country's strategy to position itself as a producer of lower-emission fossil fuels even as global energy systems transition. This dual approach of maintaining fossil fuel revenues while investing in cleaner production methods reflects Abu Dhabi's pragmatic approach to energy transition.
"The UAE recognizes that while renewables will grow dramatically, fossil fuels remain essential to global energy security for decades to come," said an industry consultant specializing in Middle Eastern energy policy. "These long-term agreements provide the revenue stability necessary to fund both traditional energy projects and the country's ambitious renewable initiatives."
Table: Key Factors, Challenges, Examples, and Policy Recommendations for Economic Diversification in Rentier States.
| Category | Description | Examples/Details |
|---|---|---|
| Key Success Factors | - Profitability of non-rentier sectors- Sufficient domestic market size- Economic inclusivity | - Dubai’s tourism/logistics- Export orientation in small states- Private sector incentives |
| Structural Challenges | - Dual labor markets- Rentier mentality- Weak institutions | - Citizens in public sector, foreigners in private- Dependency on oil/gas rents |
| Case Examples | - Dubai’s diversification- Brunei’s slow progress | - Heavy reliance on foreign labor- Small market, persistent oil dependency |
| Policy Recommendations | - Labor market reforms- Targeted investments- Strengthen institutions | - Align wages, incentivize private hiring- Invest in education, tech- Improve regulations |
Industrial Synergies and Beyond-Energy Benefits
The agreements create industrial benefits beyond the direct energy trade. Chinese shipyards have rapidly expanded their share of global LNG tanker construction, and increased LNG shipping activity directly supports this growing industrial sector.
"China isn't just buying gas — it's creating an entire industrial ecosystem around LNG imports," explains a maritime industry specialist. "Chinese shipbuilders are now among the world leaders in building specialized LNG carriers, and increased trade volume cements their position."

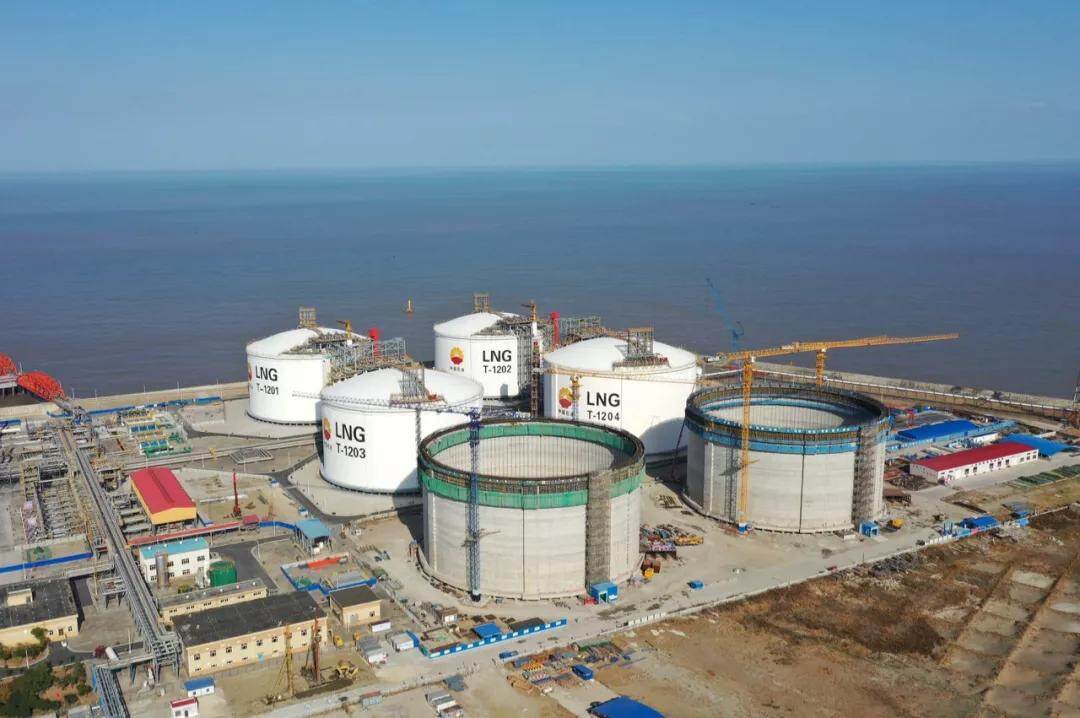
For Zhenhua Oil, the agreements coincide with the construction of its first LNG terminal in Rudong, Jiangsu province. Expected to begin operations in early 2026, this represents a significant expansion of China's LNG import capacity and creates new opportunities in logistics, storage, and downstream gas utilization.
Meanwhile, ENN Natural Gas is pursuing corporate consolidation, working to increase its holdings in EN Energy for $7.65 billion. Securing reliable LNG supply strengthens its position in these corporate maneuvers, potentially boosting valuations and expanding market share.
Climate Implications and Energy Transition Tensions
The agreements underscore the tension in China's energy transition. While the country leads globally in renewable energy deployment, it remains heavily dependent on fossil fuels, particularly coal. Natural gas represents a cleaner alternative in this transition.
"These agreements support China's efforts to improve air quality and reduce coal consumption," notes an environmental policy expert. "But they also commit significant infrastructure spending to fossil fuel systems that may eventually become stranded assets if the energy transition accelerates beyond current projections."
Comparison of CO2 Emissions per Unit of Energy from Coal, Natural Gas, and Renewables.
| Energy Source | CO2 Equivalent Emissions (g CO2e/kWh - Life Cycle Median Estimates) | CO2 Equivalent Emissions (g CO2e/kWh - Life Cycle Range) | CO2 Emissions (lbs CO2/kWh - Combustion Only, US 2023) |
|---|---|---|---|
| Coal (Unabated) | ~888 - 1000 | 740 - 1689 | 2.31 |
| Natural Gas (Combined Cycle) | ~499 - 500 | 290 - 930 | 0.96 |
| Hydropower | ~24 | 1 - 30 | Considered Carbon Neutral* |
| Nuclear | ~12 - 13 | 3 - 130 | Considered Carbon Neutral* |
| Solar PV (Utility Scale) | ~46 - 48 | 10 - 731 | Considered Carbon Neutral* |
| Wind (Onshore) | ~11 - 12 | 4 - 124 | Considered Carbon Neutral* |
Table: Overview of Stranded Assets—Definition, Causes, Examples, and Implications
| Aspect | Description |
|---|---|
| Definition | Assets losing value prematurely, unable to generate expected economic returns |
| Key Causes | Regulatory changes, technological advances, market shifts, physical/environmental risks |
| Typical Examples | Fossil fuel reserves, power plants, pipelines, outdated industrial equipment |
| Financial Impact | Write-downs, devaluations, conversion to liabilities, systemic risks to financial markets |
| Climate Connection | Highly relevant for carbon-intensive sectors due to decarbonization and climate policies |
The 15-year term of the ENN agreement extends China's commitment to natural gas well into the period when many climate models suggest dramatic reductions in fossil fuel use will be necessary to meet global climate targets.
Financial Markets React: Investment Implications
Financial markets have responded with calculated optimism to the agreements. For ADNOC, the predictable revenue streams help underpin financing for major projects and support broader economic diversification initiatives in the UAE.
"Long-term contracts are gold in today's volatile energy markets," explains a senior energy finance analyst. "They provide the certainty needed to green-light major capital expenditures and expansion projects."
Did you know? In April 2025, the Japan Korea Marker (JKM)—Asia’s leading LNG spot price benchmark—showed remarkable volatility, with prices swinging between $11.86 and $13.76 per MMBtu and daily moves reaching nearly 5% up or down. These sharp fluctuations reflect the dynamic and often unpredictable nature of the global LNG market, driven by shifting supply, seasonal demand, and broader energy trends in the region.
For Chinese energy firms, the supply security allows for more confident downstream investments in gas infrastructure, including terminals, storage facilities, and distribution networks. However, some analysts warn of potential overcapacity if China's LNG demand growth slows.
"There's a real risk of overbuilding import capacity based on optimistic demand projections," cautions a Hong Kong-based energy analyst. "If domestic production exceeds forecasts or renewables displace gas faster than expected, returns on these investments could suffer."
Reshaping Global LNG Trade Flows
The China-UAE agreements will likely accelerate shifts in global LNG trade patterns. As Chinese buyers reduce exposure to US LNG amid escalating tariffs, American exporters may redirect volumes to Europe, potentially altering price dynamics across multiple continents.
Major Global LNG Trade Flows (Map or Sankey Diagram).
| Exporting Country/Region | Importing Country/Region | Key Route/Details (Based on 2023/2024 Data) |
|---|---|---|
| United States | Europe (Total) | Largest LNG exporter globally in 2023 & 2024. Europe was the primary destination, receiving 67% of US exports in 1H23 and 53% in 2024. Key European importers include Netherlands, France, UK, Spain, Germany. |
| United States | Asia | Asia was the second largest market for US LNG, receiving 26% in 2023, increasing to 33% in 2024. Key Asian importers include Japan, South Korea, China, and India. |
| Australia | Asia | Second largest global exporter in 2023 & 2024. Primary destination is Asia, particularly Japan, China, South Korea, and Chinese Taipei. Intra-Asia Pacific trade remains significant. |
| Qatar | Asia & Europe | Third largest global exporter in 2023 & 2024. Key destinations include Asia (especially China under long-term contracts) and Europe. Acts as a swing supplier between basins. |
| Russia | Europe & Asia | Fourth largest exporter in 2023 & 2024. Exports go to both Europe (e.g., France, Spain via Yamal LNG) and Asia. |
| Algeria | Europe | Exports increased in 2023, primarily supplying European markets like Italy and France. |
| Norway | Europe | Increased exports in 2023 due to optimized plant performance, primarily serving the European market. |
Meanwhile, competition is intensifying between pipeline gas and LNG in China's domestic market. Chinese national oil companies have been lowering pipeline gas prices and increasing contract volumes, squeezing margins for LNG producers and traders.
"We're seeing the formation of regional gas markets with increasingly divergent pricing," notes an energy economist. "As China secures more long-term contracts with Middle Eastern and Central Asian suppliers, North American gas becomes increasingly isolated from Asian markets."
Comparison of Pipeline Gas vs. LNG Prices/Market Share in China.
Metric | Period | Pipeline Gas | LNG | Notes Import Share | 2023 | 41% (68.1 bcm) | 59% (97.4 bcm) | China became top global LNG importer. | 2024 (Est.) | ~42% (76.6 bcm) | ~58% (105.6 bcm) | LNG imports +9.9% YoY; total ~182 bcm. Cost (Est.) | 2024 | $8–10/MMBtu | >$13/MMBtu | Domestic gas: ~$5/MMBtu. Avg. Price | 2024 | Varies (oil-linked, long-term) | $11.90/MMBtu (Asian spot avg.) | LNG prices swayed by Europe/Asia market dynamics. | 2025 (Forecast) | Same structure | $12.89/MMBtu | Europe remains premium market. Import Volume | 2023 | 6.5 Bcf/d avg | 9.5 Bcf/d avg | Pipeline +6% YoY; LNG +13% YoY. | H1 2024 | Up (no exact % stated) | Up >14% | Total imports +14% YoY. Role in Supply | General Trend | Stable base; less price-sensitive | Flexible; highly price-responsive | LNG imports adjusted based on market shifts.
Looking Ahead: Risks and Possibilities
Despite the strategic benefits, these agreements come with significant uncertainties. If China's LNG demand underperforms projections, there's a risk of overcapacity in both import terminals and global LNG supply. Geopolitical instability in the Middle East could also threaten supply security.
Moreover, while natural gas produces fewer emissions than coal when burned, it remains a significant source of greenhouse gases. Large-scale, long-term investments in LNG infrastructure may face future regulatory or market risks as the global energy transition accelerates.
Nevertheless, the agreements represent a clear statement about both nations' vision of the energy future — one where diversification, security, and strategic partnerships take precedence over older patterns of energy trade.
As one senior energy diplomat observed: "Energy agreements of this magnitude aren't just commercial transactions — they're geopolitical statements. The China-UAE LNG deals signal a fundamental realignment of global energy relationships that will have ripple effects for decades to come."
Key Facts: China-UAE LNG Agreements
| Feature | Details |
|---|---|
| Main UAE Partner | Abu Dhabi National Oil Company (ADNOC) |
| Main Chinese Buyers | ENN Natural Gas, Zhenhua Oil, CNOOC Gas & Power Group |
| Major Agreement 1 | 1 million tons/year for 15 years (≈1.3 bcm/year) to ENN |
| Major Agreement 2 | Up to 12 cargoes/year for 5 years to Zhenhua, starting 2026 |
| Source Project | ADNOC's Ruwais LNG project |
| ADNOC Beijing Office | Opened April 2025 to strengthen business relationships |
| Strategic Benefits | Energy security, supply diversification, industrial cooperation |
| Main Limitations | Small share of China's total demand, long-term fossil fuel commitment |